
New at GIITIC

Analytics: an intelligent engine to decide with your data

Mathematical and statistical models applied to your business data, with an analytics platform, built-in BI and expert support.

  • Model-based calculation Not an LLM answer.Results are produced by the analytics engine using mathematical and statistical models.
  • Ready-made and custom models For fast adoption.Start from ready-made models when they fit your need, or set up your own models depending on their compatibility.
  • Platform and built-in BI The foundation of every solution.A data analytics platform to develop the solution and a built-in BI module to read and present the information.
  • Integration with your systems Analytics on your information.Connects analytics with the information in your systems; interfaces, data and frequency are confirmed in the project.
  • Expert consultants Support with your data.Data analysis consultants support the definition of the problem and the analysis.
What it is

Data analysis for intelligent decision-making

Analytics is a new offering in the GIITIC portfolio: an intelligent engine that produces results using mathematical and statistical models applied to your business data.

It starts from a business question and determines which type of analysis helps answer it. The offering is organized into five types of problems:

  • Forecasting

    Anticipate demand, sales and more.

    Estimate future values from history, trend and seasonality. This way purchasing, production, staffing and cash are planned ahead instead of reacting after the problem has already happened.

    Common techniques

    • Time series (ARIMA, SARIMA)
    • Exponential smoothing (Holt-Winters)
    • Prophet
    • Regression with external variables
    • Gradient boosting
    • LSTM networks
  • Predictions

    Identify the likelihood of events.

    Calculate how likely something is to happen: a customer buying or leaving, an invoice becoming overdue or a machine failing. They let you focus attention where the risk or the opportunity is greatest.

    Common techniques

    • Logistic regression
    • Decision trees and Random Forest
    • Gradient boosting (XGBoost, LightGBM)
    • Survival analysis
    • Neural networks
  • Anomaly detection

    Find unusual behavior.

    Flag what departs from usual behavior so it can be reviewed in time: data entry errors, process deviations or possible fraud, before they turn into losses.

    Common techniques

    • Statistical control (z-score, control charts)
    • Isolation Forest
    • Local Outlier Factor
    • Autoencoders
    • Change point detection
  • Segmentation

    Get to know your customers, products and data better.

    Group customers, products or records with similar characteristics. They reveal patterns that are not obvious at first glance and let you treat each group differently.

    Common techniques

    • K-means
    • Hierarchical clustering
    • DBSCAN
    • RFM analysis
    • Dimensionality reduction (PCA)
  • Optimization

    Improve how resources are allocated.

    Look for the best possible allocation of limited resources (inventory, capacity, routes or staff) according to the business objectives and constraints.

    Common techniques

    • Linear and integer programming
    • Constrained optimization
    • Heuristics and metaheuristics
    • Monte Carlo simulation
    • Vehicle routing (VRP)
Use cases

Use cases by area

Analytics use cases organized by area. The scope of each case is confirmed when your project is sized.

Analytics areas

Sales

More opportunities, more revenue

Use cases

  • Sales Forecasting

    Estimates sales for upcoming periods by product, customer, channel or region from history and seasonality, to set targets and plan ahead.

  • Opportunity Close Prediction

    Calculates the probability that each pipeline opportunity will be won based on its stage, age, amount and interactions, to focus the sales team and project closings.

  • Customer Decline Detection

    Identifies customers whose purchase frequency or value drops compared with their usual behavior, so you can reach out before losing them.

  • Next Purchase Prediction

    Estimates when a customer is likely to buy again and which products, to schedule visits, offers and replenishment at the right time.

  • Anomalous Sales Detection

    Flags sales with prices, discounts, quantities or margins outside the norm, to review errors, exceptions or practices that affect profitability.

Marketing

More relevant customers

Use cases

  • Customer Segmentation

    Groups customers by purchase behavior, value and characteristics (for example, RFM) to design campaigns and offers tailored to each segment.

  • Purchase Propensity

    Calculates the probability that each customer will buy a product or respond to a campaign, to direct marketing investment to those with the most interest.

  • Churn Prediction

    Estimates the risk that a customer will stop buying or cancel based on recent activity, to trigger retention actions in time.

  • Customer Lifetime Value Prediction

    Projects the value a customer can generate over their relationship with the company (CLV), to decide how much to invest in acquiring and serving them.

Inventory

Availability at lower cost

Use cases

  • Demand Forecasting

    Estimates future demand by product and warehouse considering trend, seasonality and events, as a basis for buying and replenishing without excess or shortages.

  • Stockout Prediction

    Anticipates which products are at risk of running out of stock in each warehouse or point of sale, to replenish or transfer before losing sales.

  • Inventory Optimization

    Calculates reorder points, safety stock and order quantities that balance service level with the capital tied up in inventory.

  • Inventory Anomaly Detection

    Finds unusual differences, movements or adjustments in stock that may indicate data entry errors, shrinkage or losses.

Purchasing

Better sourcing decisions

Use cases

  • Purchasing Needs Forecasting

    Projects what, how much and when to buy based on expected demand, stock and lead times, to plan supply.

  • Supplier Delay Prediction

    Estimates the probability that a purchase order will arrive late based on the supplier history, the product and the season, to plan alternatives.

  • Abnormal Price Detection

    Flags purchases with prices above or below what is usual for the product or supplier, to review negotiations or errors before paying.

  • Supplier Performance Prediction

    Anticipates each supplier's expected performance in lead times, quality and quantities, to support selection and negotiation.

Finance

Greater control and profitability

Use cases

  • Cash Flow Forecasting

    Projects cash inflows and outflows by combining expected collections, scheduled payments and history, to anticipate cash shortfalls or surpluses.

  • Collections Prediction

    Estimates when and how much each customer in your accounts receivable will pay based on their payment behavior, to improve the income projection.

  • Delinquency Prediction

    Calculates the risk that an invoice or a customer will become overdue, to prioritize collections and adjust credit terms.

  • Anomalous Transaction Detection

    Identifies payments, journal entries or movements that fall outside the usual pattern by amount, frequency, time or counterparty, for review.

  • Financial Forecasting

    Projects revenue, costs, expenses and results for upcoming periods to support budgeting and scenario comparison.

Production

Greater operational efficiency

Use cases

  • Production Forecasting

    Estimates the volumes to produce by product and period from expected demand, to plan materials, shifts and capacity.

  • Failure Prediction

    Calculates the probability of failures in the process or in machines from operating variables, to intervene before they stop production.

  • Process Deviation Detection

    Flags batches or orders whose times, consumption or parameters depart from the standard, to correct the process in time.

  • Quality Prediction

    Anticipates whether a batch will meet specifications from raw materials and process conditions, to adjust before producing defects.

  • Capacity Optimization

    Assigns orders to lines, machines and shifts to make better use of available capacity and meet committed dates.

Maintenance

Greater asset availability

Use cases

  • Predictive Maintenance

    Estimates the right time to service each machine based on its usage, readings and failure history, to maintain before failure and not on a fixed calendar.

  • Useful Life Prediction

    Calculates the remaining useful life of equipment and components to plan replacements, spare parts and budget ahead of time.

  • Equipment Anomaly Detection

    Identifies equipment readings, consumption or behavior that fall outside the norm, as an early sign of a problem.

Human Resources

More productive teams

Use cases

  • Turnover Prediction

    Estimates employee turnover risk from work-related variables, to focus retention actions on key profiles.

  • Absenteeism Forecasting

    Projects expected absenteeism by area and period, to plan replacements and workloads.

  • Staffing Needs Forecasting

    Estimates how many people and with what profiles are needed based on expected demand and operations, to plan hiring and shifts.

  • Payroll Anomaly Detection

    Flags unusual payments, adjustments, overtime or deductions before payroll is processed, to avoid errors and improper payments.

Customer Service

Better experiences

Use cases

  • Request Volume Forecasting

    Projects the volume of requests, calls or tickets by channel and time slot, to size the support team.

  • SLA Breach Prediction

    Calculates which cases are at risk of missing their response or resolution time, to prioritize or escalate them in time.

  • Repeat Issue Prediction

    Estimates the probability that a case will be reopened or that the customer will complain again, to resolve the cause at first contact.

Logistics

More reliable deliveries

Use cases

  • Delivery Time Forecasting

    Estimates the delivery time of each shipment based on route, load, destination and season, to commit to realistic dates with the customer.

  • Delay Prediction

    Calculates the risk that a shipment will arrive late, to notify the customer or take action before missing the commitment.

  • Route and Load Optimization

    Defines the order of deliveries and the assignment of loads to vehicles considering distances, capacities and time windows, to reduce travel.

Management

Data-driven decisions

Use cases

  • KPI Anomaly Detection

    Monitors key indicators and flags variations outside what is expected, so management finds out in time and not at month-end close.

  • KPI Forecasting

    Projects the behavior of key indicators to anticipate whether the period targets will be met.

  • Trend Change Detection

    Identifies the moment an indicator changes trend, to tell normal variations apart from changes that require a decision.

  • Root Cause Analysis

    Identifies the variables that best explain a variation in a result (by customer, product, region or period) to understand why and act on the cause.

From data to decision

End-to-end data management

A good model starts long before the analysis. We support the whole journey of the data: from when it is recorded in the operation until the result returns to it.

  1. Capture and store
  2. Extract
  3. Consolidate
  4. Process
  5. Model
  6. Analyze
  7. Execute
  • Capture and store

    GIITIC modules record the operation at its source (sales, purchasing, inventory, finance, production) with master data and validations, and store it in their databases. Well-captured data is the foundation of any model.

  • Extract

    The E in ETL: with the integration with external systems, data is taken from GIITIC modules and your other sources (systems, spreadsheets, databases or APIs), with full or incremental loads.

  • Consolidate

    Sources are unified in an analytics repository: codes are standardized, customer and product master data are matched, duplicates are removed and the history the models need is kept.

  • Process

    The T in ETL: cleaning and preparing the information. Missing values and outliers are handled, units and currencies are standardized, data is aggregated by period and the variables that feed the models are built.

  • Model

    Consultants choose the technique based on the business question, train the model with history and validate it with data it has not seen, measuring its error before using it. You can start from ready-made models or set up your own.

  • Analyze

    Results reach GIITIC's BI module: dashboards, indicators and queries to see trends, compare scenarios and understand the reasons behind each result.

  • Execute

    The result returns to the operation as alerts, prioritized lists or parameters for your processes, and a Workforce AI agent can use it in authorized tasks. Model performance is monitored and updated when the data changes.

Pillars

Calculated results to support your decisions

Results calculated with mathematical rigor to support reliable decisions.

  1. Model-based calculation

    Results are produced by the analytics engine using mathematical and statistical models, not an answer generated by an LLM.

  2. A business question as the starting point

    Each analysis answers a specific decision and the data available to make it.

  3. Five types of problems

    Forecasting, predictions, anomaly detection, segmentation and optimization.

  4. A complement to Workforce AI

    Analytics calculates; a Workforce AI agent can communicate the result or use it in an authorized task.

Analytics platform

The elements to solve each problem

Platform, BI, integration, models and expert consultants: the elements of the Analytics offering. Their scope is defined for each case.

Let's talk about your data
  • Data analytics platformThe foundation to develop the analytics solution for your project.
  • Built-in BI moduleSupports reading and presenting your business information.
  • Integration with external systemsConnects analytics with the information in your systems.
  • Expert data analysis consultantsThey support the definition of the problem and the analysis.
  • Ready-made models for fast adoptionStart from ready-made models when they fit your need.
  • Custom modelsThe option to set up your own models, depending on their compatibility.
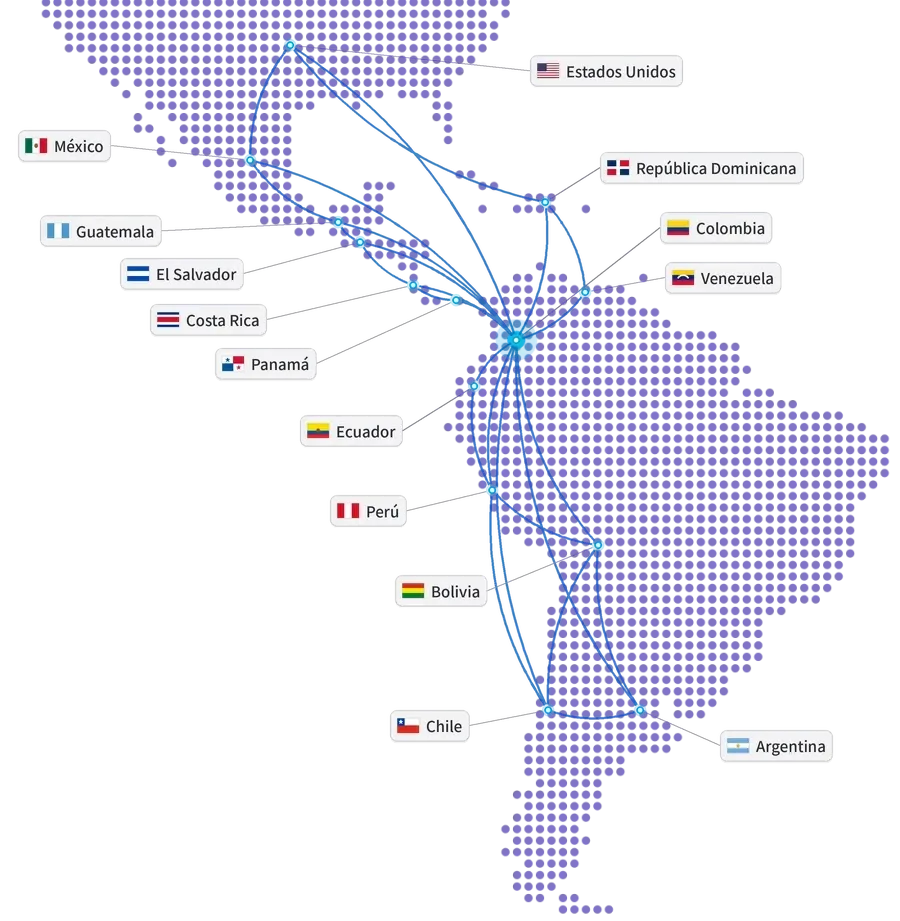
Map of the Americas with the United States, Mexico, Guatemala, El Salvador, Costa Rica, Panama, Dominican Republic, Colombia, Venezuela, Ecuador, Peru, Bolivia, Chile and Argentina connected from Colombia
Our track record

Global experience at your service

Years of experience
15+
Companies in Latin America
850+
Countries
10+
Integrations
100+
ERP and ERP+ modules
40
AI agents
20+

Companies that trust GIITIC

Frequently asked questions

What people usually ask us about Analytics

What's new about Analytics?
It is a new GIITIC offering that combines an analytics engine, platform, built-in BI, models and integration, with the support of expert consultants.
What problems does it address?
Five types: forecasting, predictions, anomaly detection, segmentation and optimization.
What is it for if I already have BI?
Analytics brings together an analytics platform, built-in BI, integration, consultants and models applied to a business question. How it coexists with your current tools is reviewed in each case.
Is my data ready, and how much history do I need?
Data quality and requirements are assessed for each case before proposing an implementation.
Does it integrate with our systems?
Integration with external systems is part of the offering; interfaces, permissions, data and update frequency are confirmed in the project.
Are there ready-made models, and can we set up our own?
Yes, both options are part of the offering. The fit of ready-made models and the conditions for setting up your own models are validated for each case.
Are its results generated by an LLM?
No. The analytical result is calculated by the engine using mathematical and statistical models, and its accuracy is evaluated based on the model and the data. Workforce AI, which uses generative AI, can complement the interaction and the tasks based on those results.
How do we get started, and when do you quote?
We talk about the decision and your data, meet with the areas involved and size the case. The quote comes afterward; we don't publish prices.
Next step

Start with a decision you make today with little information

Tell us which business question you want to answer and what data you have. We size the case and then prepare the proposal.

  • A conversation about your decision and your data.
  • Meetings with the areas involved.
  • A proposal after sizing.

Let's talk about your data

Fill in your details and a consultant will get in touch with you.

Fields marked with * are required.

Open in a new tab